
EP&T Global
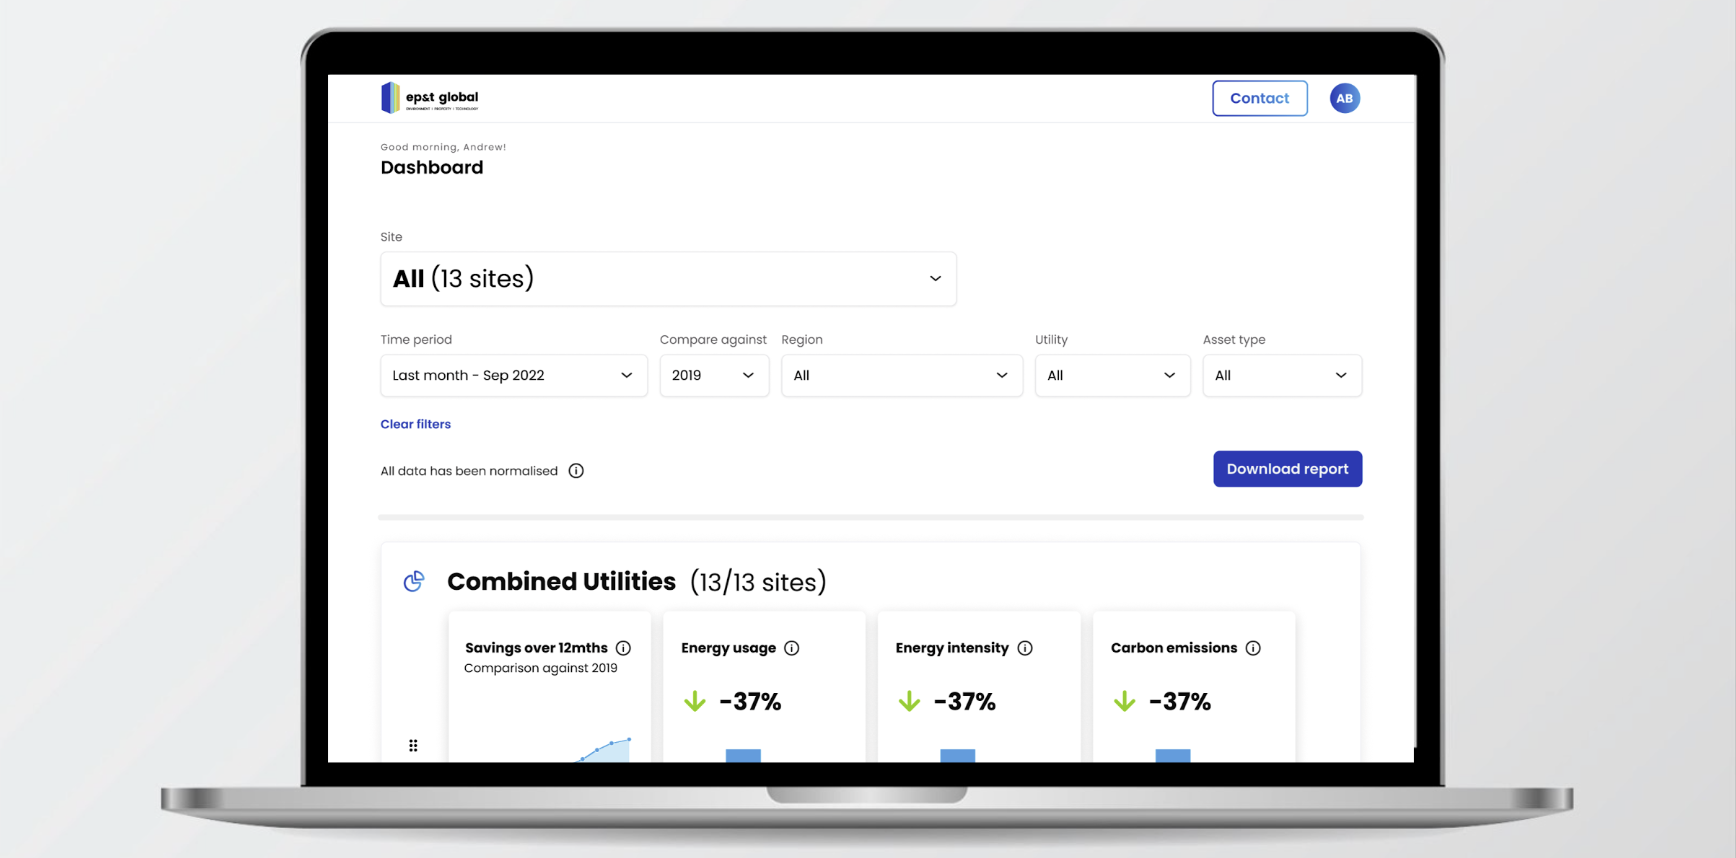
Asset manager DASHBOARD
Energy analytics platform for commercial buildings
Overview
EP&T helps large commercial buildings reduce energy consumption, operating costs, and emissions through energy analytics.
However, asset managers struggled to understand building performance using the existing platform. The system was designed for technical users and required heavy support from EP&T account managers.
I led an 8-week design engagement to explore how a dedicated reporting experience could better support asset managers.
The outcome was a responsive dashboard concept designed to simplify building insights and improve reporting.
Problem
Asset managers lacked a clear way to monitor and communicate building performance.
Key challenges included:
• No dedicated reporting interface for asset managers
• Low adoption of the existing Edge platform
• Overwhelming technical data not suited to their role
• Heavy reliance on EP&T support teams
• Difficulty explaining energy performance to stakeholders
Without improving the experience, there was a risk of client churn due to competing tools.
My Role
Product Designer (Consultant)
During the engagement I:
• Facilitated discovery and assumptions workshops
• Conducted user interviews with asset managers
• Ran sketching and ideation workshops with internal teams
• Designed low → mid → high fidelity prototypes
• Conducted multiple rounds of usability testing
• Delivered a high-fidelity prototype for engineering
Research Insights
Through interviews and testing we discovered several key behaviours:
Asset managers are extremely time-poor
They need quick answers to questions like:
• How are my buildings performing?
• Which buildings need attention?
• Are we tracking against targets?
Other insights included:
• Data accuracy and transparency are critical
• Asset managers prefer trends and comparisons over raw metrics
• Portfolio comparisons help identify underperforming buildings
• Dashboards must support stakeholder storytelling
We also learned that notifications were rarely effective — urgent issues were usually resolved through phone calls.
Design Approach
The product evolved through three rounds of iterative testing.
We explored:
• Portfolio performance dashboards
• Building comparison tools
• Target tracking and sustainability reporting
• Data visualisation for stakeholder presentations
Each iteration helped refine how complex energy data could be presented as clear, actionable insights.
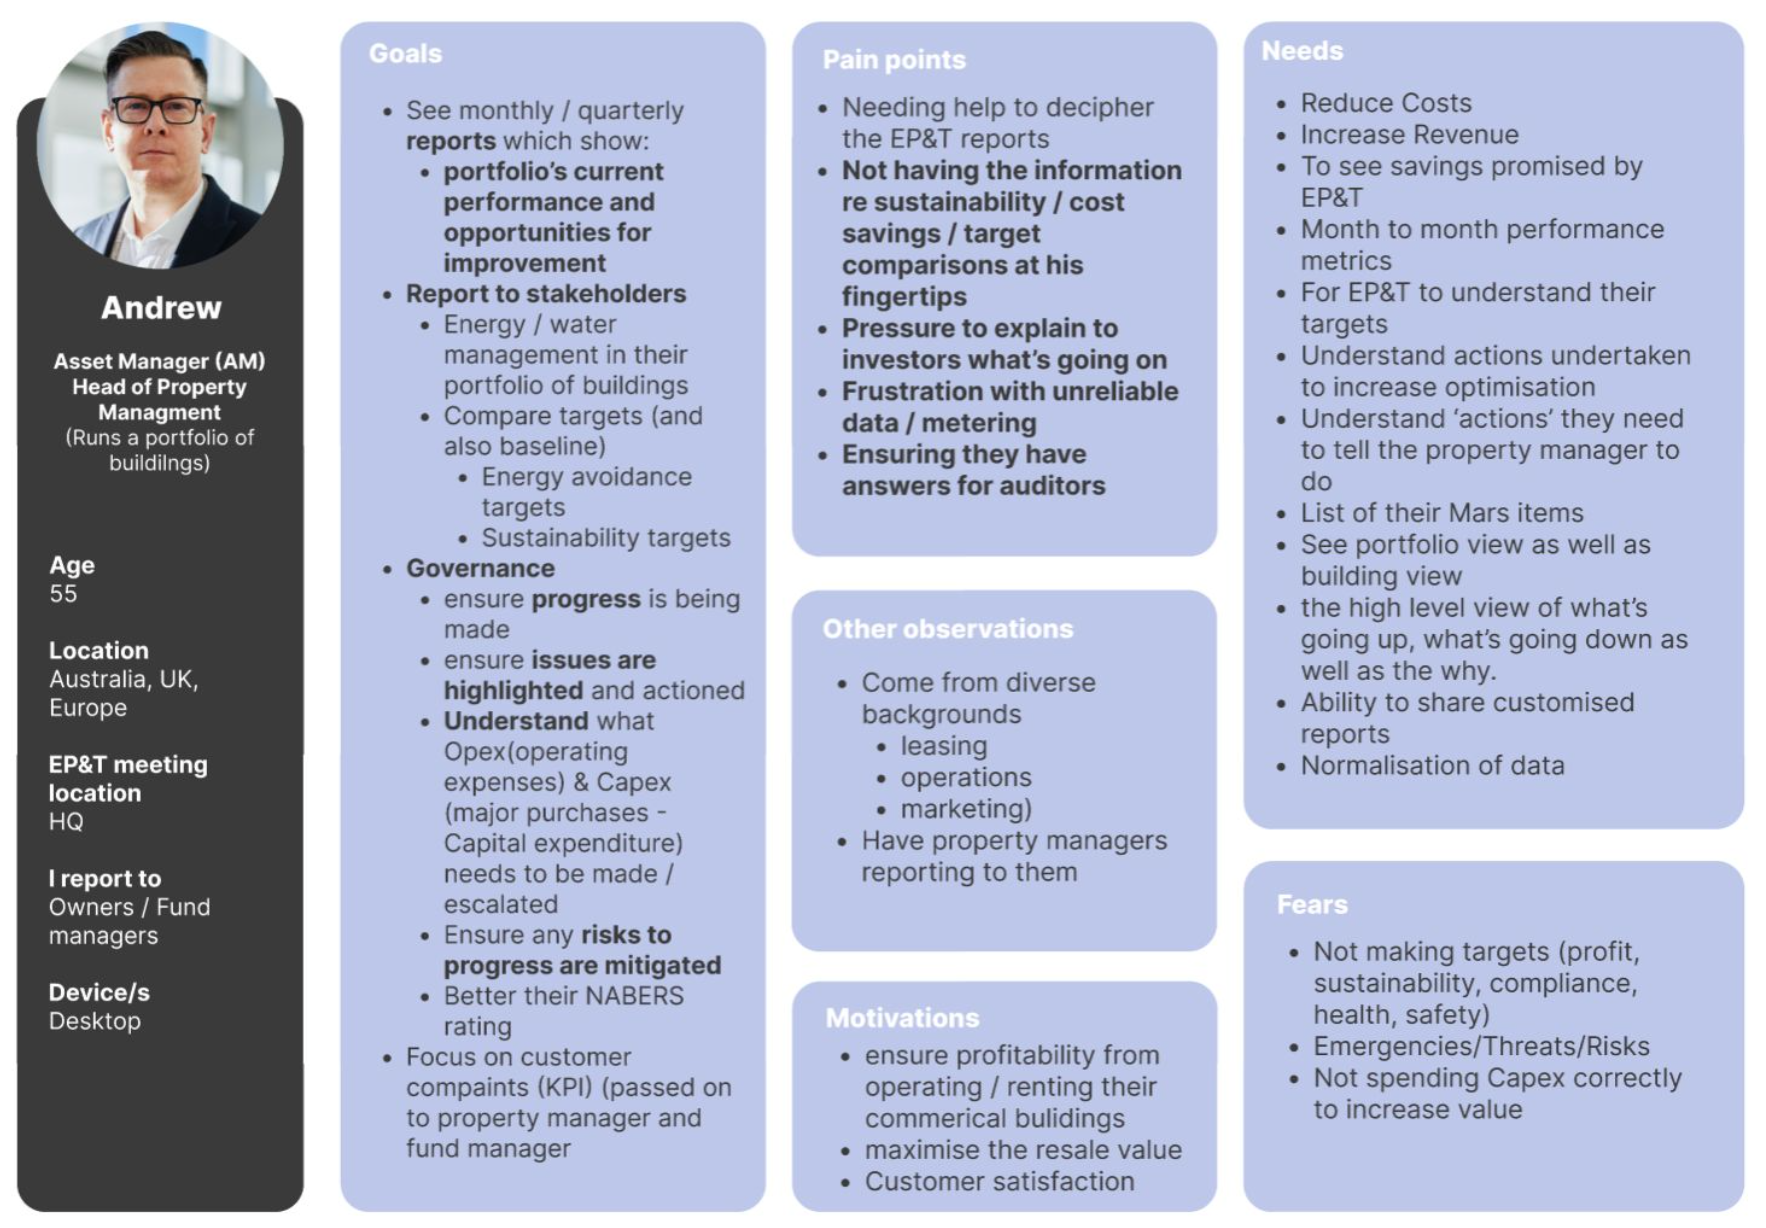
Persona - Andrew the asset manager
Andrew seeks an overview of building performance to govern effectively, report on energy usage, and ensure sustainability practices.
Assumptions workshop
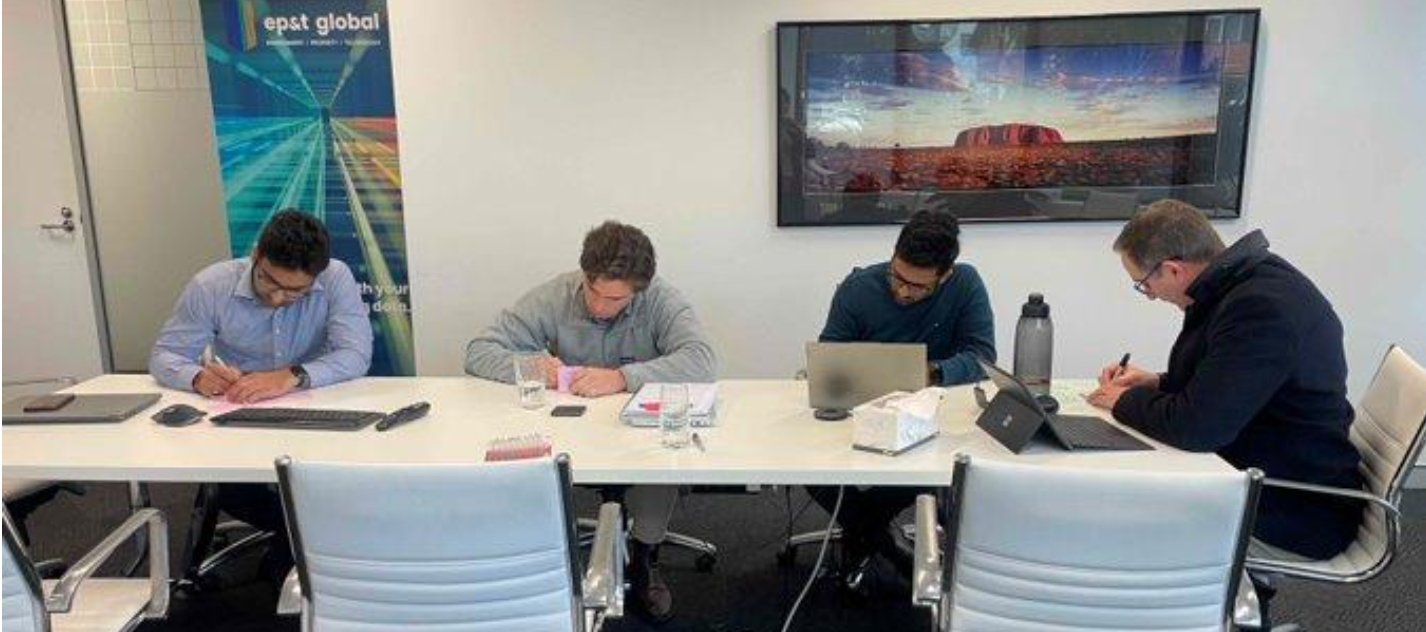
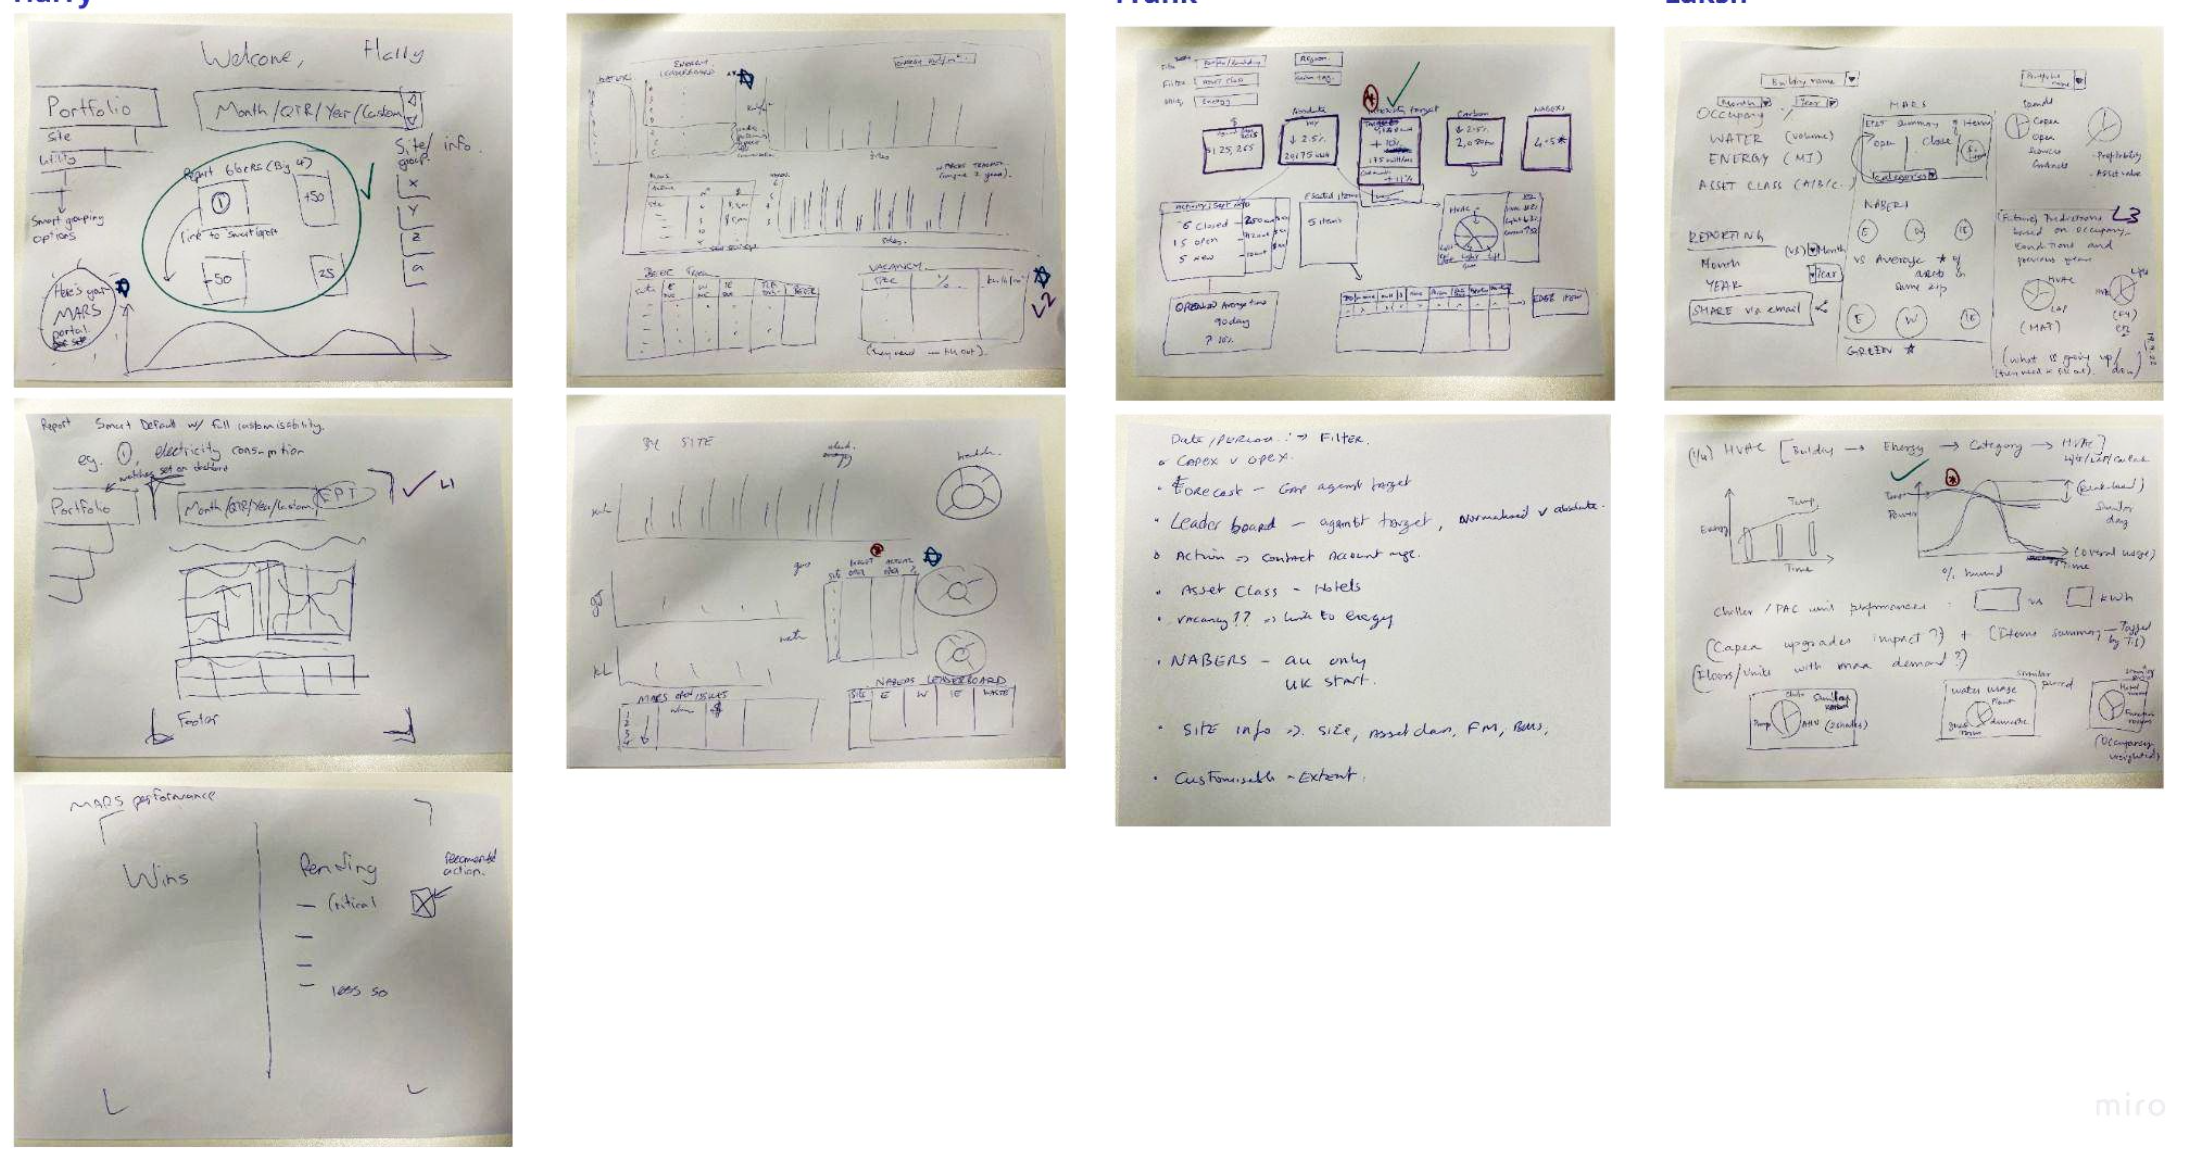
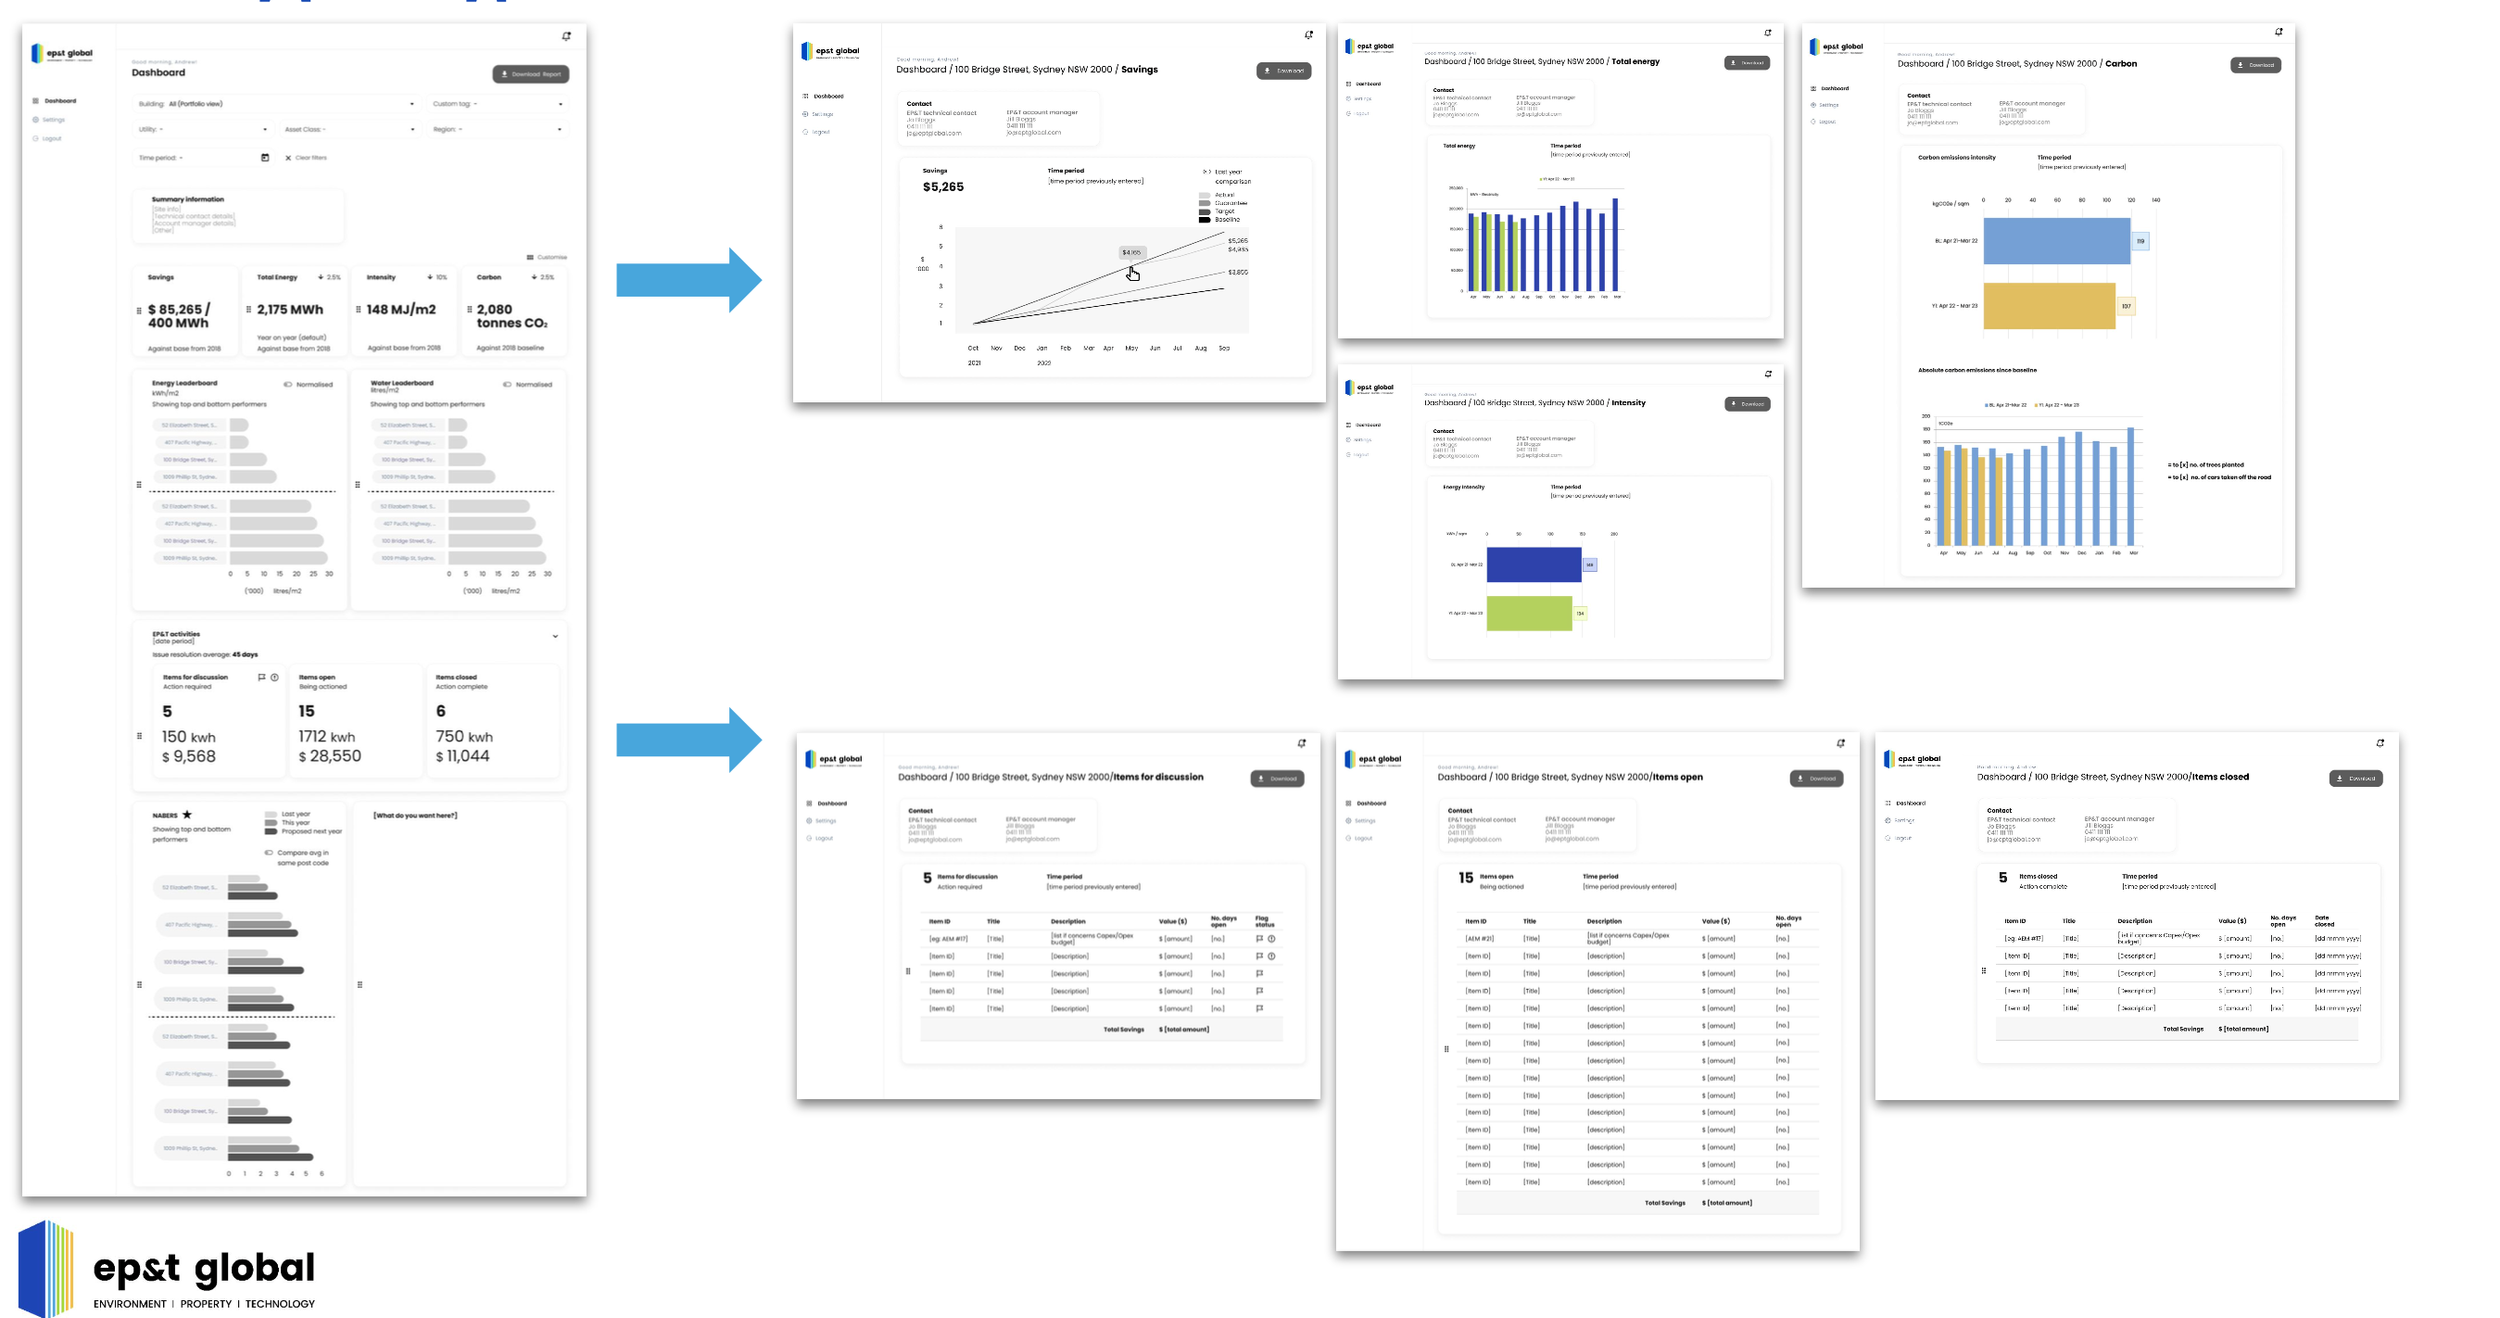
Sketch session
Sales, Technical and Product got in a room to sketch out ideas for the dashboard
Low fidelity prototype
Interview Synthesis
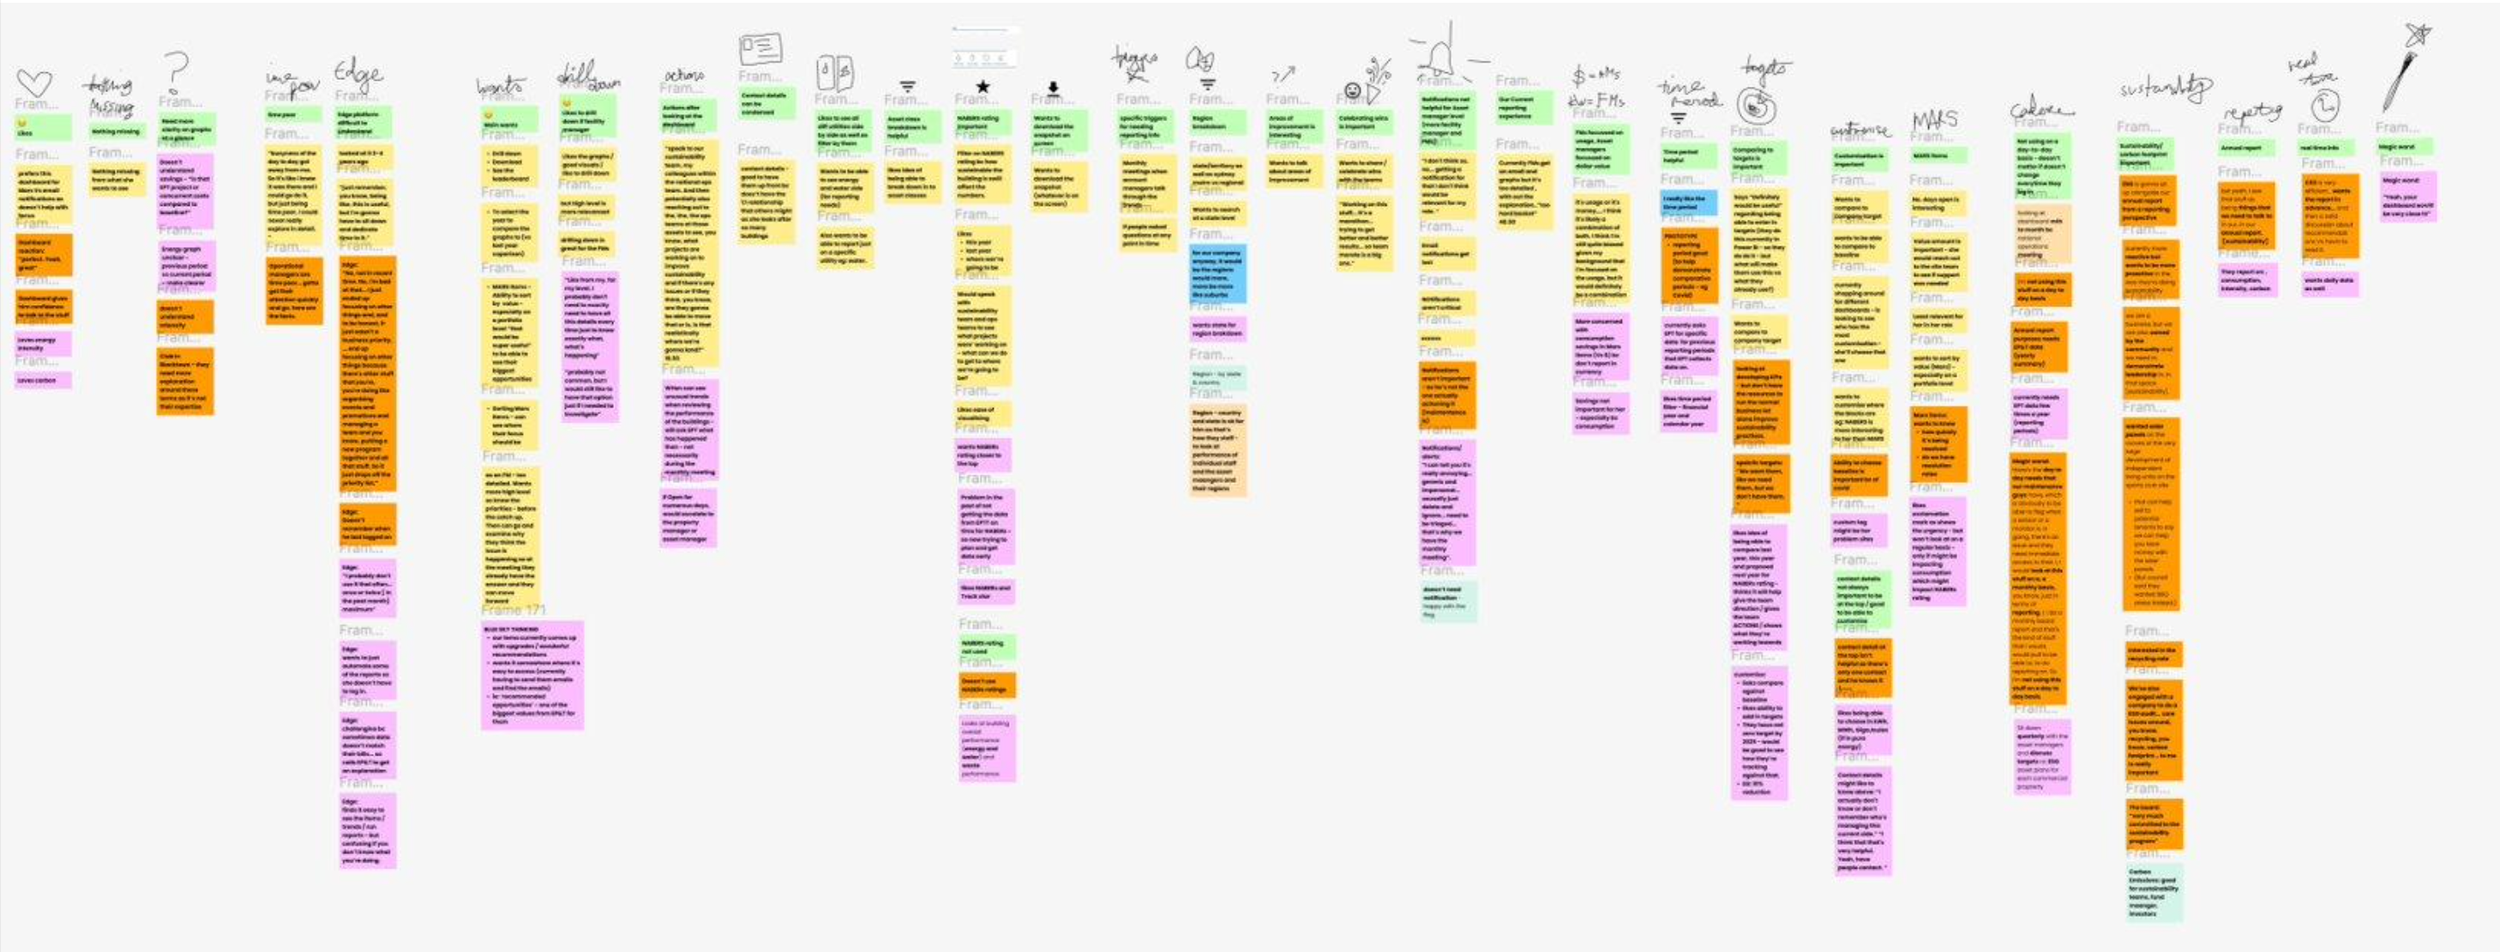
Insights
Asset managers are time-poor; information should be presented quickly.
The Edge platform is challenging to understand.
Need for actionable insights and trends.
NABERS ratings are of importance
Normalisation is important.
Preferences for phone calls over notifications.
Notifications not helpful - that’s more for facility managers
“I can tell you it's really annoying... generic and impersonal... usually just delete and ignore... need to be triaged... that’s why we have the monthly meeting”
Need ability to choose comparison year (eg: avoid Covid timeframes).
Doesn’t use the data in their day-to-day, so doesn’t matter if it’s not updated in real time.
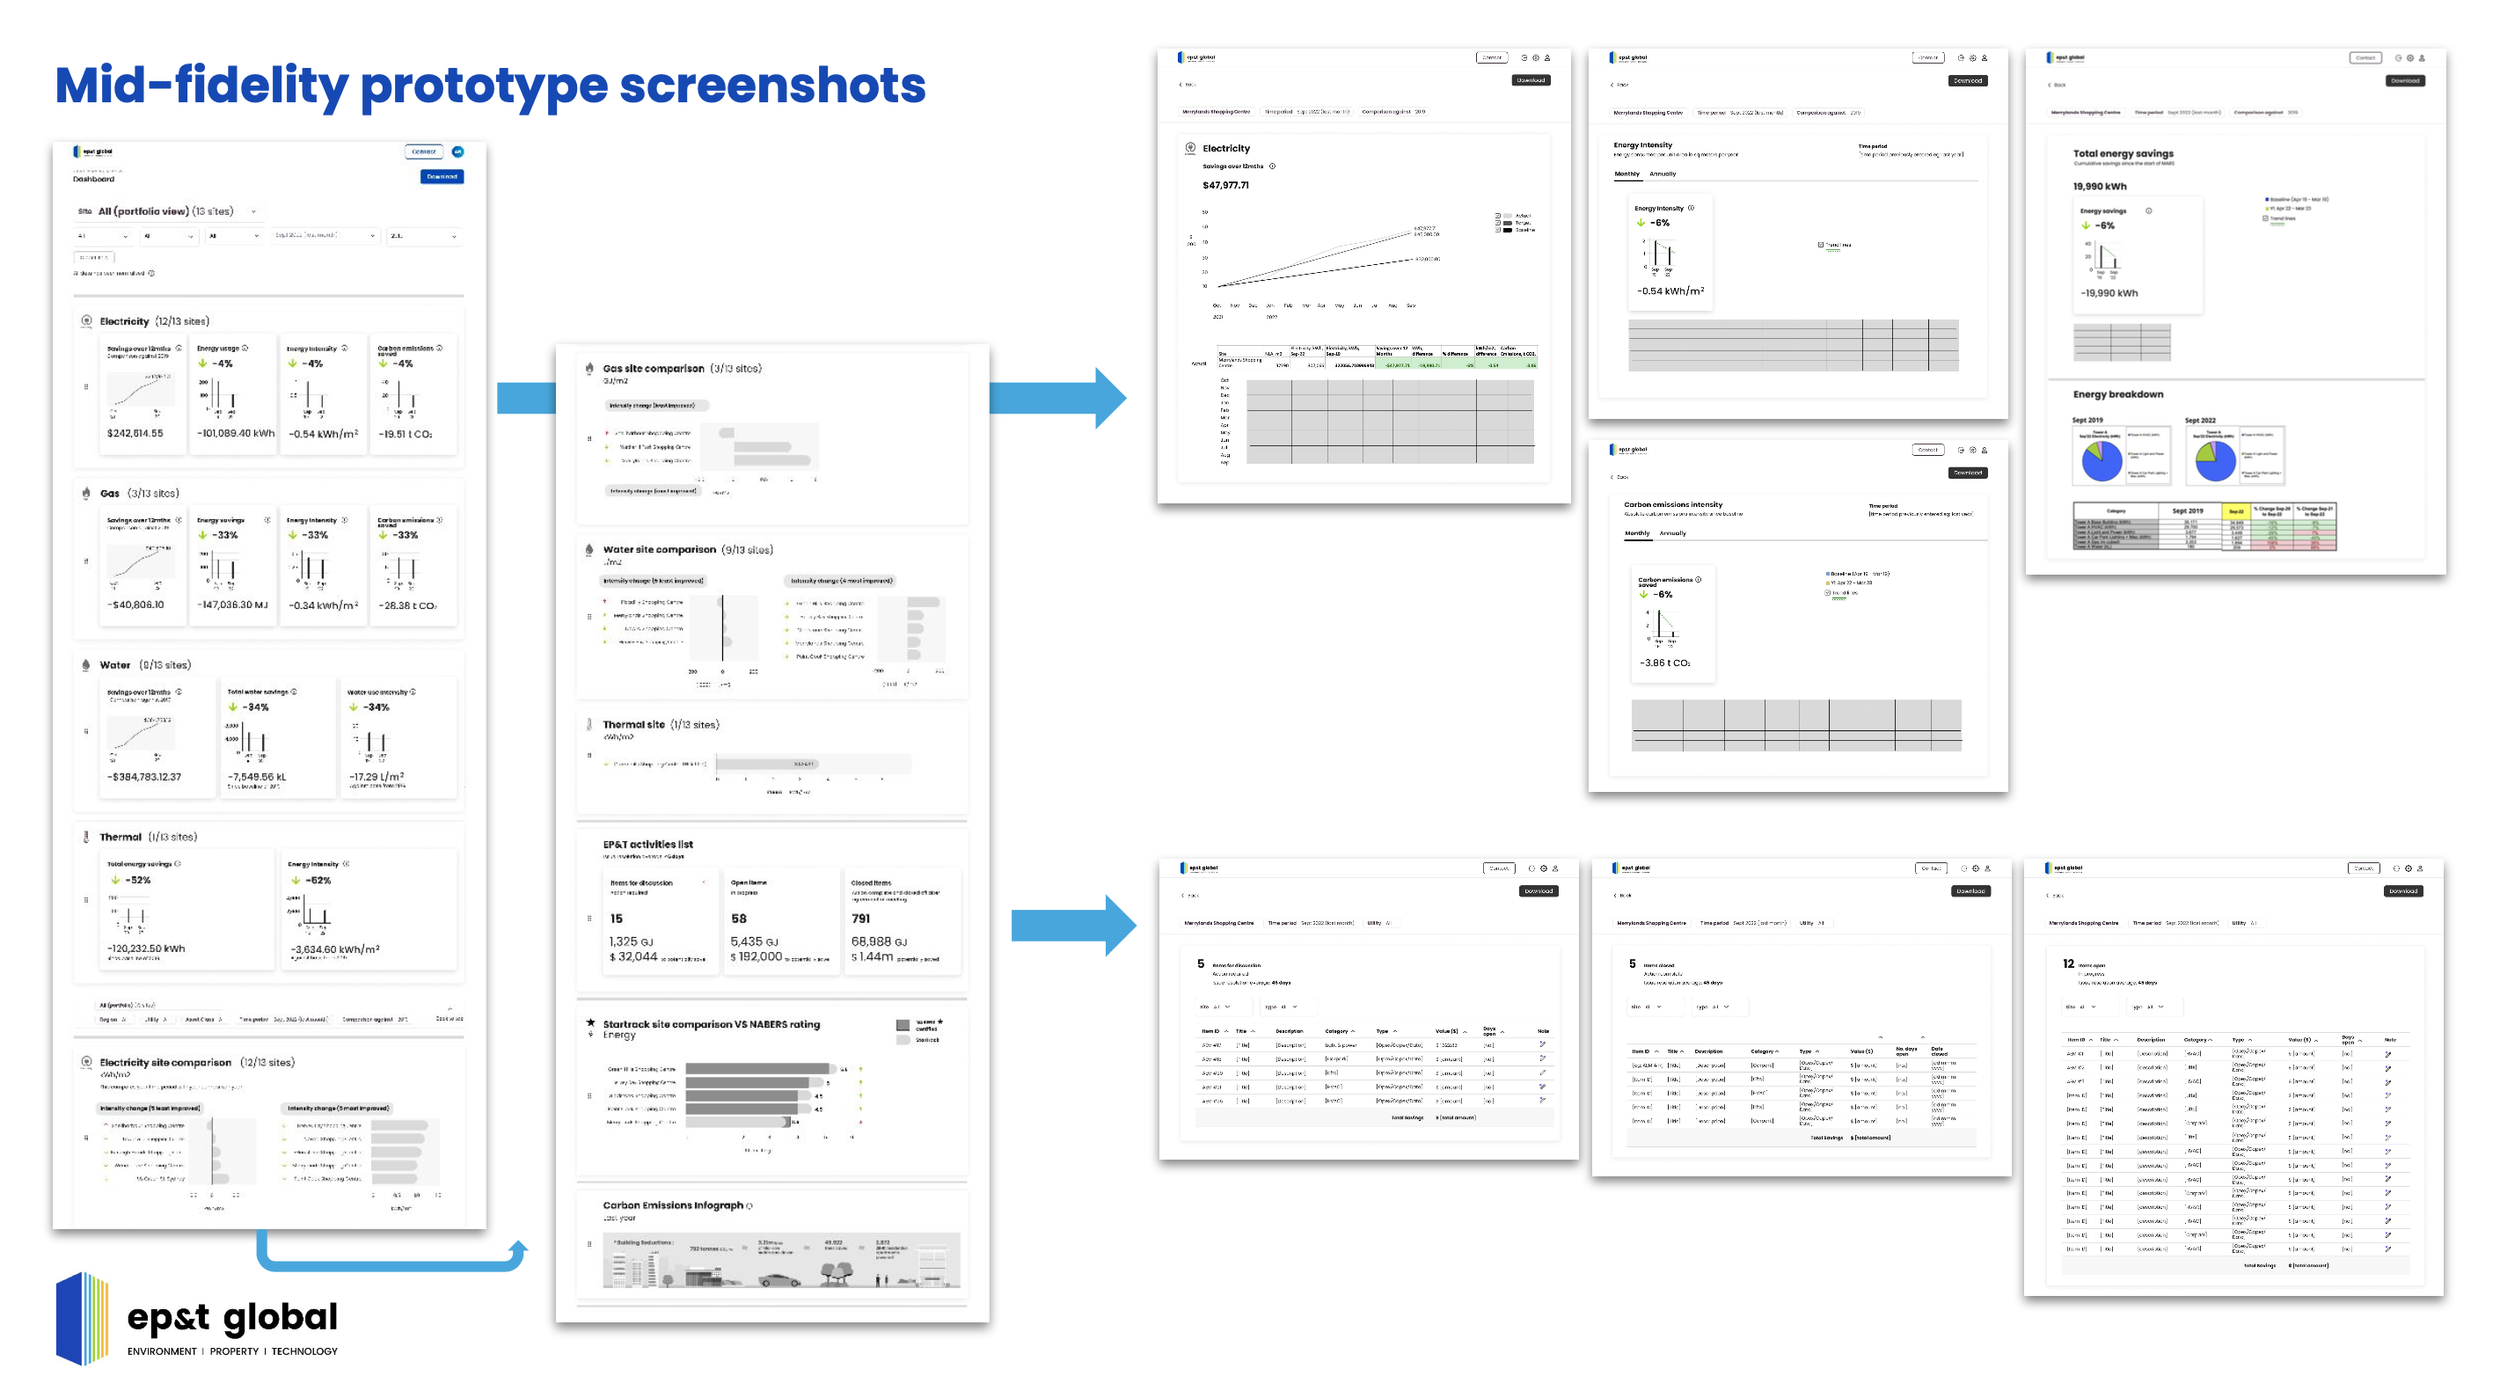
Mid fidelity prototype then designed for testing
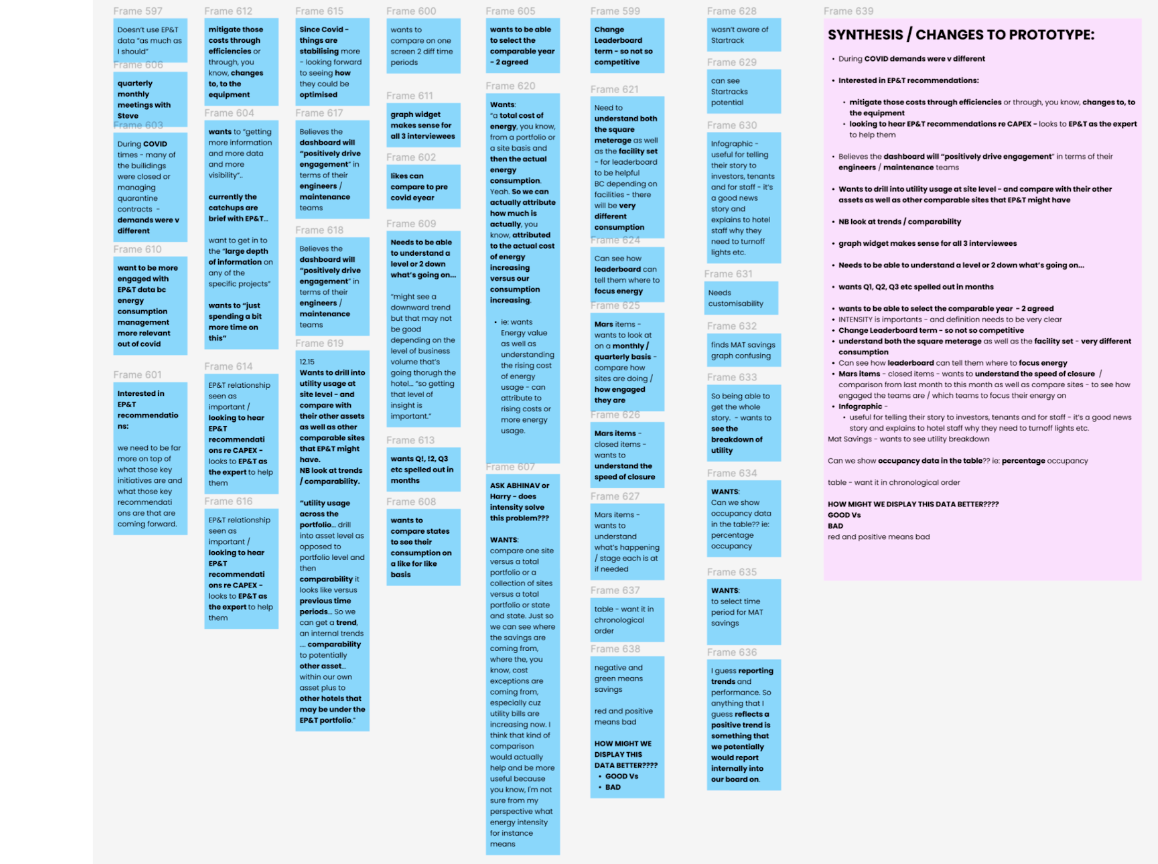
Round 2 interviews synthesis
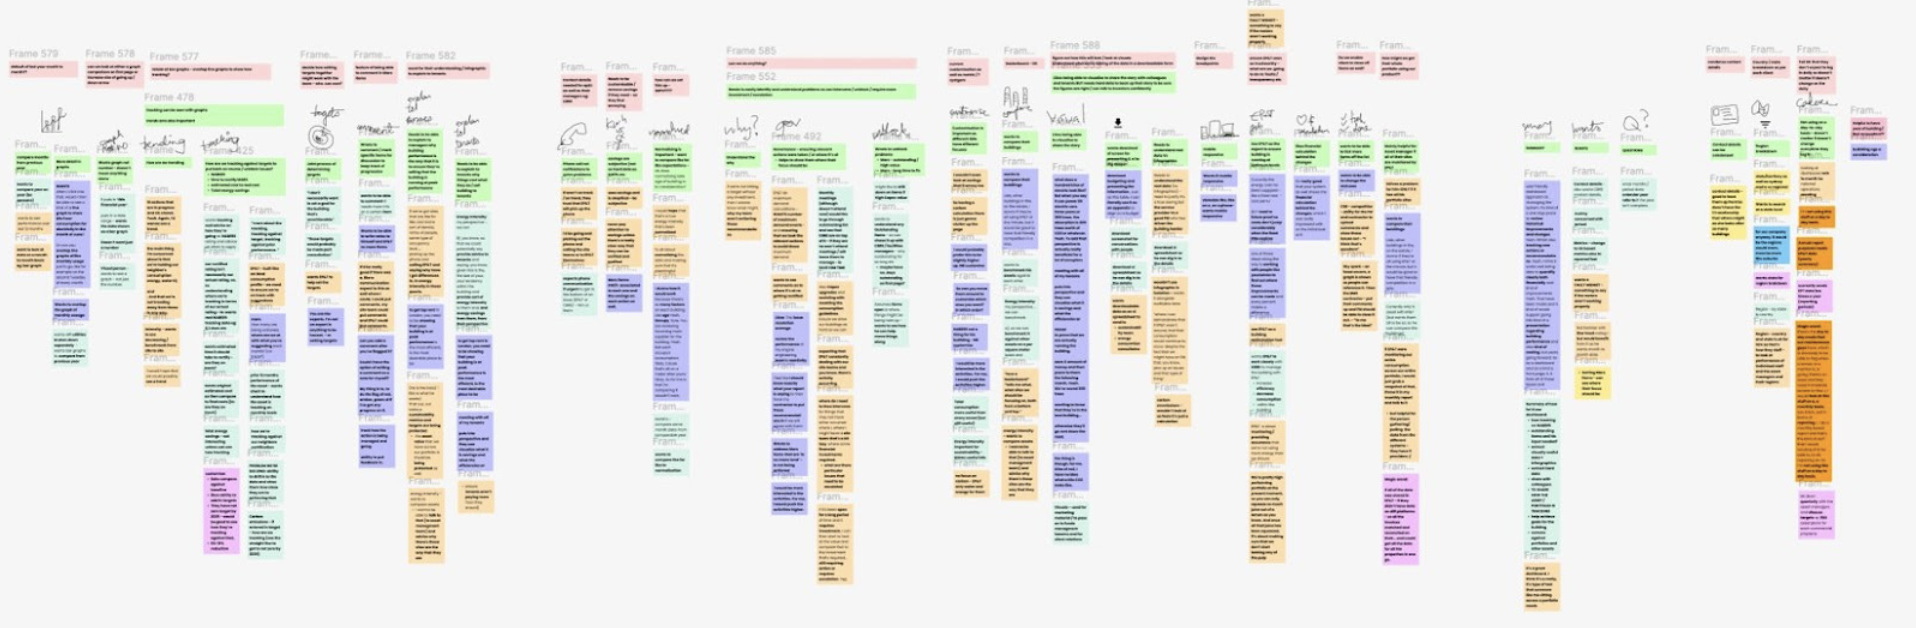
Round 3 - prototype testing / interview synthesis
Internal feedback session was held

Suggestions taken in to consideration and balanced with customer interviews
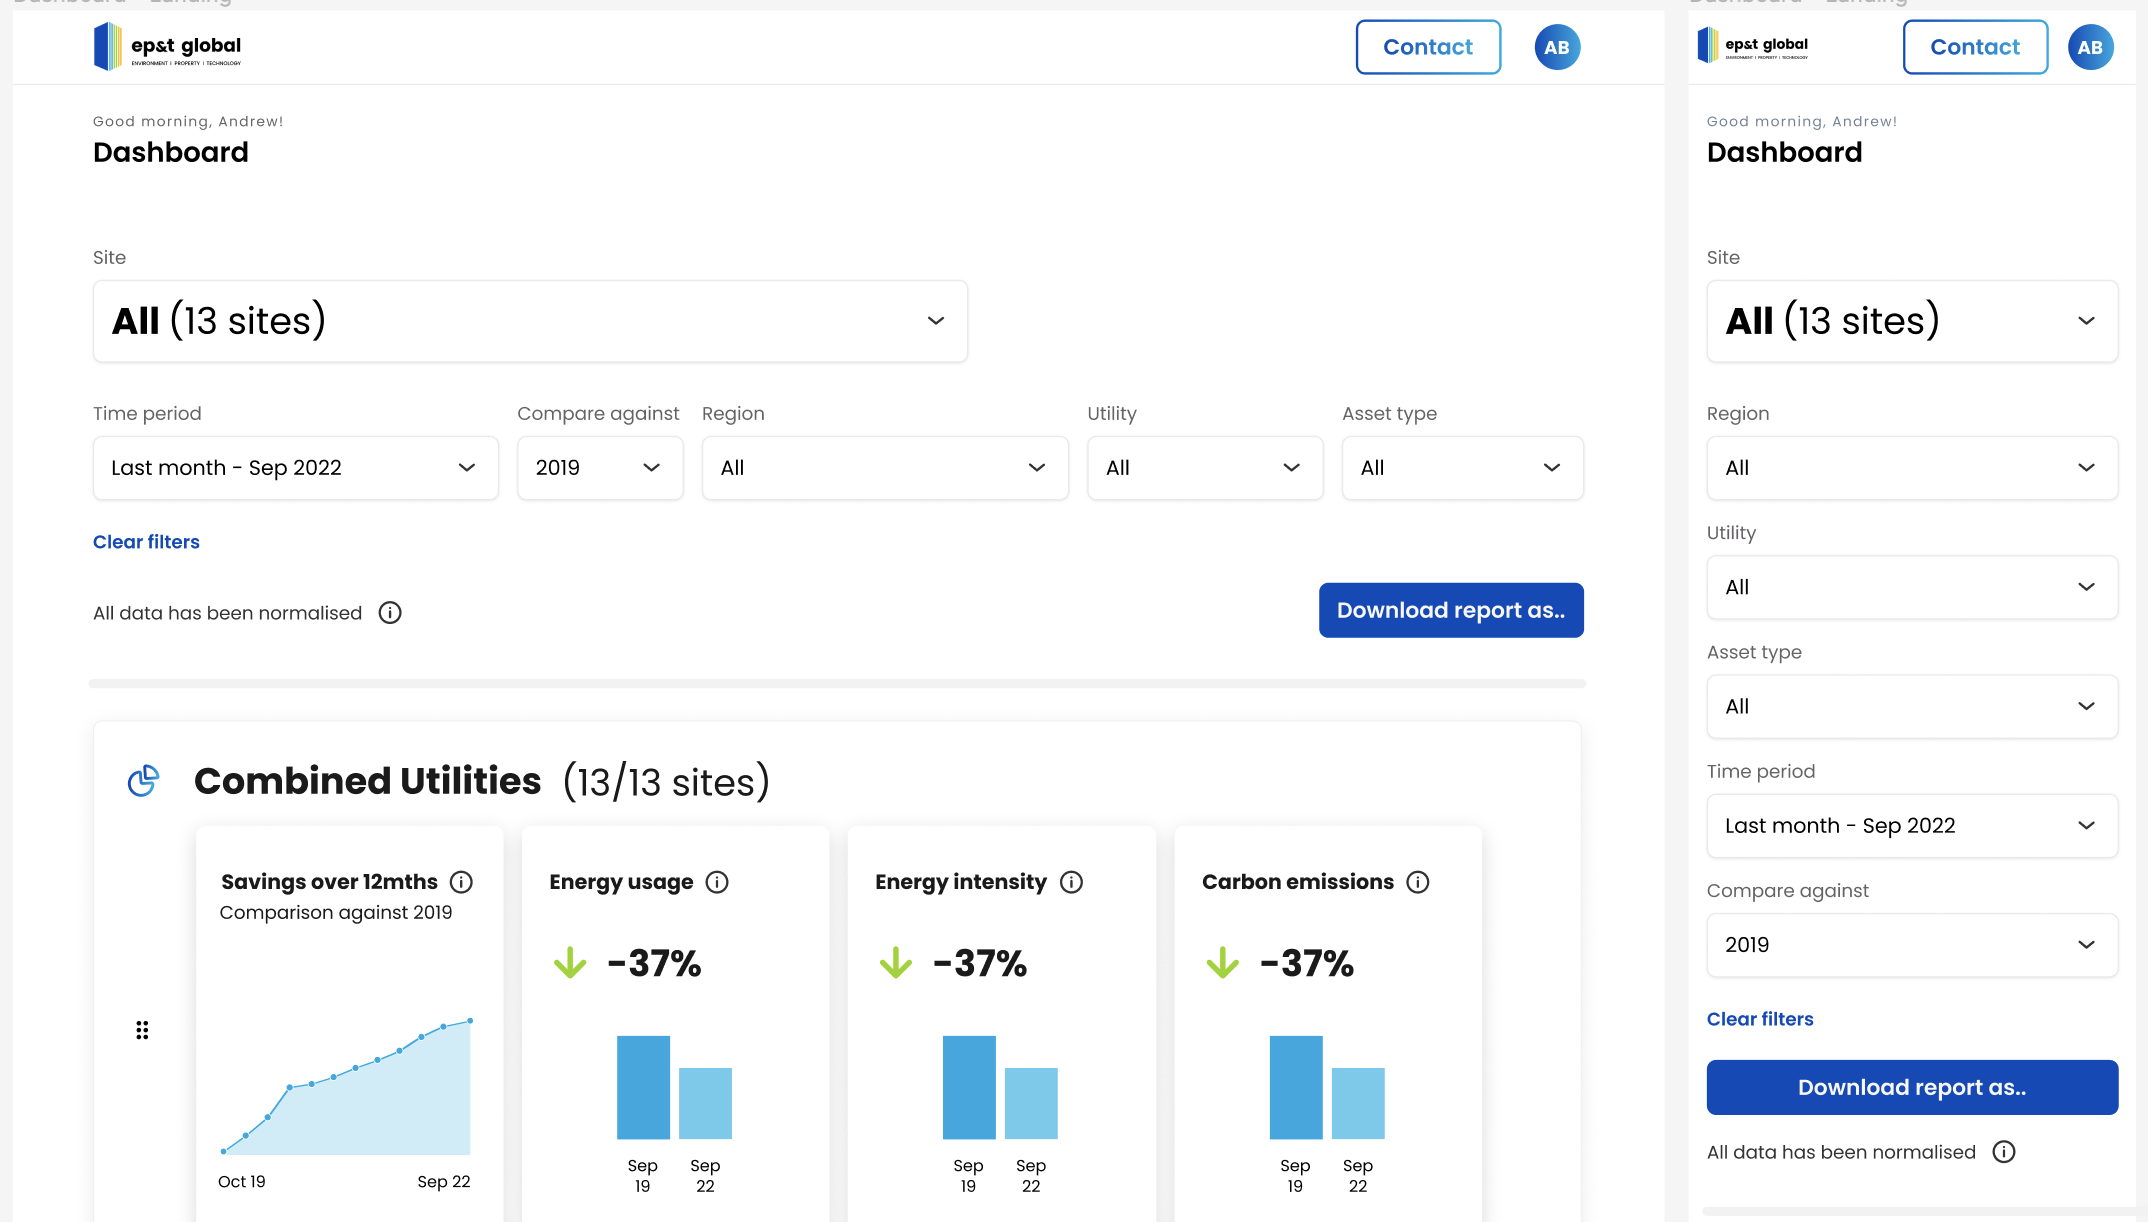
High fidelity prototype (desktop & mobile responsive)
Aha moments
The app will reduce meeting time between EP&T and AMs, thus saving them money.
The term 'leaderboard' is seen negatively - needed to be more sensitive and positive - to encourage.
Both infographics and detailed spreadsheets are necessary - depending on who they were telling the story to (investors (to dig in to the detail), tenants or staff (to tell a good story)).
Although normalisation was important to include in the longer term, AMs had a good grasp of their buildings, so had a base understanding of why buildings might perform and compare the way they did, in the meantime.
AMs preferred phone calls over notifications. Notifications tended to be ignored as they’re so busy. If something was important, a phone call would be the best way to get things done.
Urgent need for a dedicated and collaborative product team.
Final Concept
The final prototype introduced a responsive dashboard experience that allowed asset managers to:
• Monitor performance across their portfolio
• Compare buildings and identify issues quickly
• Track progress against sustainability targets
• Visualise trends for stakeholder reporting
• Export insights for presentations and analysis
The design balanced high-level insights with access to deeper data, enabling both storytelling and operational analysis.
Outcome
The concept demonstrated how EP&T could transform complex energy data into clear, actionable insights for asset managers.
Expected benefits included:
• Reduced reliance on account managers
• Shorter client reporting meetings
• Improved transparency around building performance
• Better communication of sustainability outcomes